Making Assumptions Based on the ‘Average’ Performance of the S&P 500 Can Be Dangerously Misleading
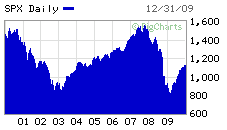
Executive Summary: Wall Street regularly promises holders of IRAs, 401(k)s and other retirement accounts that over time they can expect average annual returns as high as 12%, based upon past performance. But the theoretical results seldom hold up in real-world conditions and savers and investors who plan based upon such claims often wind up with serious financial shortfalls.
By Pamela Yellen and Dean Rotbart
Stock index averages can be dangerously misleading for those trying to anticipate how far into retirement their savings will carry them.
To illustrate, assume that in 1975, the year Woody Allen’s Love and Death was released, ‘Boris,’ a 30-year-old herring factory worker, invested $1,000 in a stock index fund mirroring the S&P 500 and didn’t touch it again through the end of 2009.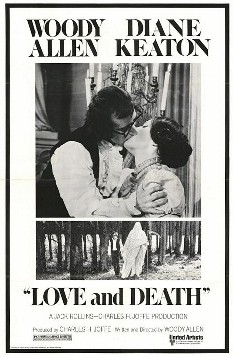
[For more on why Woody Allen would not make a good financial advisor, See: Sure-Fire Results: How Old Sensibilities Are Proving a Potent Balm for Modern Personal Finance Ailments]
For our calculations, we’re using the stock market “CAGR-lator” (compound annual growth rate calculator) available for free at MoneyChimp.com.
After 35 years, when Boris reached age 65, his $1,000 would have grown to $11,920 dollars, or a 7.34% inflation adjusted annualized return.
On paper, that’s not bad and might even justify an ‘invest-it-and-forget-it’ approach to retirement planning.
The rub arises, however, in the fact that reality is rarely ‘on-paper’ perfect.
Had Boris instead invested that same $1,000 at the start of 1977, when he turned 32, he would only have a portfolio valued at $7,770 at the end of 2009, a 6.41% inflation adjusted annualized return.
Assume further, for the sake of illustration, that Boris was slow to the party and didn’t invest his $1,000 until January 1, 2000, at age 55. Better late than never, you may be thinking?
In this case, however, never was clearly the superior choice.
One thousand dollars invested at the start of the year 2000 in a fund tracking the S&P 500 would only be worth $710 a decade later, an annualized inflation-adjusted return of negative 3.42%.
On Closer Examination, Staggering Losses
All this, of course assumes a one-time investment left untouched for one or more decades. In reality, almost no one invests in such a manner.
 [Learn more about the surprising reality of the actual results people get in the stock market and why.]
More realistically, and often much to their detriment, most individuals using IRAs, 401(k)s and other self-directed retirement plans add fresh, hard-earned dollars to their stock fund portfolios each and every year. Hence, as their total portfolios grow and compound, so does the risk and size of potential losses.
As bad as the S&P performance from 2000 through 2009 may appear on first pass, for a worker who contributed fresh dollars each year and whose annual contributions were larger year-over-year, the loss in absolute dollars is staggering.
Let’s enlist Boris once again and assume that he rose steadily through the ranks of the herring factory. By the start of calendar year 2000, at age 55, he was in middle management and in a strong position to put funds aside for retirement.
Here is how Boris’s cinéma vérité star turn would have unfolded:
2000: An Initial Investment
- On Monday, January 3, 2000, the first trading day of the New Year, Boris invests $10,000 in a mutual fund that mirrors the S&P 500. He will stick with that fund for a decade.
- When the markets close on Friday, December 29, 2000, Boris’ portfolio is worth $8,800, an annualized inflation-adjusted return of negative 12.09%.
2001: A 17.7% Loss
- On Tuesday, January 2, 2001, Boris adds a fresh $12,000 to his portfolio. That brings his total portfolio value on this day to $20,800. His total invested is $22,000.
- Monday, December 31, 2001, is the final trading day of the year. At the market close, Boris’s portfolio stands at $18,096. So far he has lost 17.7% of his money.
2002: The Loss Widens
- Despite his setbacks to date, Boris remains confident in the long-term outlook for the S&P 500. So on Wednesday, January 2, 2002, he adds a fresh $14,000 to his portfolio, which now stands at $32,096. His total invested to date is $36,000.
- In 2002, the S&P falls for the third consecutive year. At the close of trading on Tuesday, December 31, 2002, Boris’s portfolio is worth $24,354, a one-year decline of 24.12%. Overall, Boris has lost 32.35% of the money he has invested thus far.
2003: Still in the Red
- “This will be the year,” Boris tells himself. “The market can’t go down forever.” So on Thursday, January 2, 2003, Boris adds a fresh $16,000 to his portfolio, which now stands at $40,354. His total invested to date is $52,000.
- Boris’s instincts were correct. The market did rebound and in glorious fashion, up 26.3% on the year. On Wednesday, December 31, 2003, Boris is pleased to see that his portfolio is worth $50,967. His money has now been tied up for four full years and his loss only amounts to $1,033, or about a negative 2%.
2004: A 5-Year Rate of Return of 1.10%
- Boris is feeling more confident than ever that the S&P 500 will deliver for him. Moreover, his herring career is going swimmingly, having been named vice president of pickling. So like clockwork, on the first trading day in 2004, Friday, the 2nd, Boris adds $18,000 to his portfolio, which now stands at $68,967. His total invested to date is $70,000.
- Who says herring merchants can’t beat the market? The S&P 500 advances 7.21% on the year and on Friday, December 31, 2004, Boris’s portfolio is worth $73,940. He’s in the black (after just five years)! Boris brags to the head of the anchovy division that he has achieved a 5-year rate of return of 1.10%.
2005: S&P is Up 1.21%
- It is January 2005. George W. Bush is about to be inaugurated for his second term as President and Boris is in high spirits. Now that his portfolio is in the black, Boris breaks with his annual $2,000 year-over-year investment contribution and plunks down a $5,000 year-over-year increase, making a total $23,000 addition to his portfolio on Monday, January 3, 2005. His portfolio balance is now $96,940. His total dollars invested to date are $93,000.
- Okay. It wasn’t a great year. But the S&P 500 did advance 1.21% and with it Boris’s portfolio has grown to $98,976 as of Friday, December 30, 2005. That is a 1.04% rate of return over six years.
2006: In the Money
- Medical studies reporting on the cardiovascular benefits of fish oil have buoyed the herring business. Boris is promoted to senior vice president of canning. On Tuesday, January 3, 2006, comfortable in his vision of a safe, secure and prosperous retirement nest egg, Boris adds $28,000 to his portfolio. His account now shows a balance of $126,976. His total invested to date is $121,000.
- Boris rethinks his retirement plans. Maybe instead of a condominium in Toledo, he’ll retire to one in Miami Beach. And why not? The S&P 500 advanced a sweet 12.8% this year. That brings the value of his portfolio to $143,229, a seven-year rate of return of 2.44%.
2007: Advances Five Years in a Row
- “Don’t argue with success,” Boris thinks. The S&P 500 has been up for four consecutive years. So, without hesitation, on Tuesday, January 2, 2007, he adds $33,000 to his investment account. That brings his balance to $176,229. His total invested to date is $154,000. He now has earned $22,229 (before fees and taxes), 14.4% more than if he had simply stashed his money in a barrel.
- Five in a row! The S&P closes out 2007, on Friday, December 31st, up 1.17% on the year. Boris is elated. His portfolio now stands at $179,225. It’s been eight years and he is averaging an annual rate of return of 1.91%. “Perhaps,” Boris muses, “trees do grow to the sky.”
2008: Shock and Awe
- Boris is tempted to invest even more than usual this year in his retirement portfolio. The company’s board has promoted him to C.D.O. (chief deboning officer) and he is flush with bonus income. But there is some buzz about weakness in the mortgage markets, so Boris doesn’t splurge. On Wednesday, January 2, 2008, he adds a total of $38,000 to his investment account, a year-over-year contribution just $5,000 larger than in 2007.
Boris is now sitting comfortably atop a plump retirement account worth $217,225. His total invested to date is $192,000.
- It is Friday, December 31, 2008, and Boris’s gilded herring retirement boat has capsized. Not only is the year finished, so are Boris’s dreams of that retirement condo in Miami Beach. Heck, even Toledo is looking iffy.

The S&P 500 dives 37.28% on the year, taking Boris’s nine-year savings anchor down with it. His portfolio now stands at $136,352, a net loss of $55,648. That equates to an annual negative rate of return of 3.73%.
2009: The Lost Decade
- Boris isn’t alone, since misery loves companions. He is bowed, but not broken. Boris pulls a jug of wine sauce from his office cooler, quaffs more than a few swigs, but goes ahead on Friday, January 2, 2009, and puts $43,000 of his precious funds into his retirement portfolio, which now stands at $179,352. He has deposited $235,000 to date.
- In 2009, the stock market does recover – up 23.66% in fact. But as Boris discovers when he reviews his portfolio statement on Thursday, December 31, 2009, the bounce isn’t enough to restore his 2008 losses, much less justify a full decade of risking his money in the volatile stock market.
Boris’s final accounting for ten years of investing reads like this*:
- Total invested: $235,000
- Total on deposit: $221,787
- Net loss: $13,213
- Net loss percentage: 5.6%
- Net negative annual rate of return: 0.58%
*Note: Boris’s results from 2000 through 2009 are adjusted for inflation. However, they do not factor in taxes and the inevitable account fees/expenses that would have further dampened his performance. As we reported in our October 2010 Cover Story on so-called ‘Zombie Investors,’ visible and hidden fees when compounded over the decades – especially in 401(k) plans – can eat away as much as 39% of an investor’s entire life-long savings. (Government regulations would have limited Boris’ annual contributions to a 401k – fortunately for him.) The authors used www.MoneyChimp.com and its CAGR (Compound Annual Growth Rate) calculator to obtain the theoretical results contained in this article.
False Promises Equate to Very Real Shortfalls
Had Boris actually realized the 7.34% average annualized return that he originally anticipated, his portfolio would have ballooned to $322,179, not counting fees and taxes.
[Many Wall Street advisors promise annualized returns as high as 12%. See: Sure-Fire Results: How Old Sensibilities Are Proving a Potent Balm for Modern Personal Finance Ailments]
While Boris’s experience is only a fish tale, the two lessons it highlights are authentic:
1. People’s real-world experience in the stock market and stock market funds frequently vary – often to their serious detriment – from the charts and tables that depict ‘average’ performance. Reaching the forecast average return, even over a period of a decade or more, is far from a sure, or safe, bet.
2. The closer individuals are to retirement – and presumably the larger their portfolios – the more they stand to lose in a market downturn and the less likely they’ll be able to recover even if the market subsequently rises.
A 10-year, 20-year or even 30-year average portfolio performance record is irrelevant to the investor who deposits a disproportionate amount of funds in the final three or five years of a career-long investment journey. Likewise, if portfolio losses are sustained close to the end of that journey, they will be harder, if not impossible, to recoup.
© 2010 Hayward-Yellen 100 Ltd Partnership

